
1. 내용
Azure Kubernetes Service에서 Grafna Loki & Prometheus를 이용해서 Container Log Monitoring & Application Metric Monitoring 진행하는 실습
1) 데이터 유형
- Promeheus : 주로 시계열 메트릭 뎅터를 수집하고 저장
- Grafana Loki : 로그 데이터를 수집하고 저장하는데 특화
2) 데이터 모델
- Prometheus : 레이블을 사용하여 다차원 데이터 모델을 지원
- Grafna Loki : 로그 라인에 레이블을 지정해서 로그 관련 데이터 저장
3) 쿼리 언어
- Prometheus : PromQL(Prometheus Query Lanaguage)를 사용
- Grafana Loki : LogQL을 사용하며, 이는 PromQL에서 영감을 받았지만 로그에 특화되어있음
4) 용도
- Prometheus : 시스템 및 애플리케이션 성능 모니터링
- Grafana Loki : 컨테이너 로그 집계 및 분석
5) 데이터 보존
- Prometheus : 일반적으로 단기 데이터 보존에 사용
- Grafana Loki : 장기 로그 보존에 더 적합
Prometheus 와 Loki 둘 다 Grafna에서 UI로 모니터링이 가능합니다.
2. 순서
- Azure Kubernetes Service 배포
Private AKS 환경에서 진행
- helm chart를 이용해서 Grafana Loki & Prometheus 배포
- 웹브라우저로 접속하여 모니터링 테스트
간단한 Web Container 배포
- Loki 배포 후 모니터링 테스트
- Azure Blob Storage에서 로그 저장 확인
3. 테스트
1) Azure Kubernetes Service 배포
- Vnet & Subnet CIDR : 10.0.0.0/16 & 10.0.4.0/24
- K8S Service CIDR : 20.0.0.0/16
- K8S DNS CIDR : 20.0.0.10
2) helm chart를 이용해서 Grafana Loki & Prometheus 배포
- Azure kubernetes Service를 배포하면 기본적으로 helm이 설치되어 있다.
- helm repo Prometheus 추가
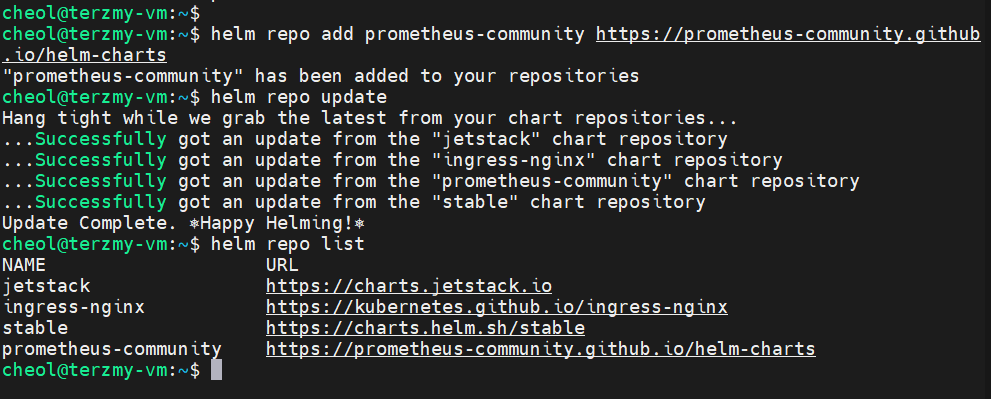
-helm chart 설치
helm install prom-stack prometheus-community/kube-prometheus-stack --namespace prometheus-grafana --create-namespace
- Grafna 접근
prom-stack-grafana의 Service Type을 LoadBalancer로 변경해줘서 외부에서 접근하기 쉽도록 한다.
테스트를 쉽게하기 위해서 외부 노출하였다. 웹 브라우저로 External IP로 접근하면된다.

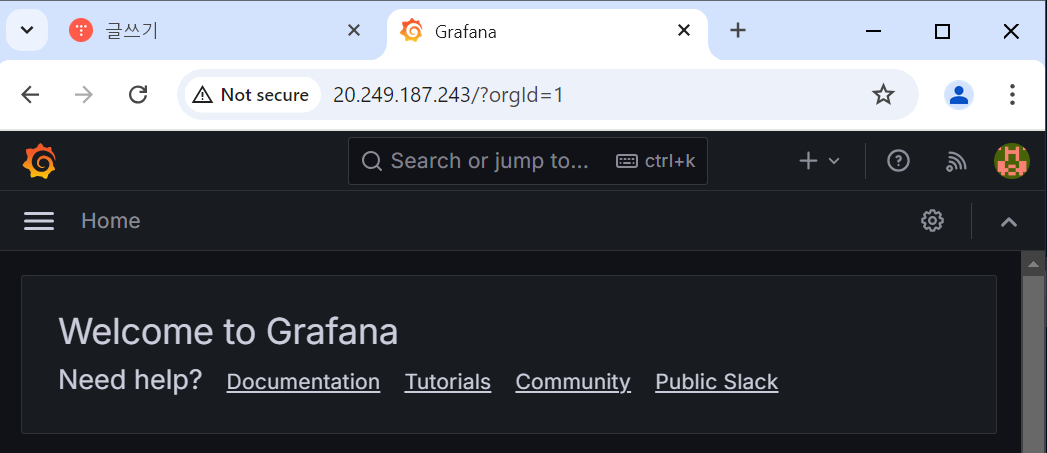
초기 ID / PW : admin / prom-operator
- Prometheus 접근
Grafana와 동일하게 Service Type을 LoadBalancer로 변경해서 외부에서 접근이 가능하도록 하였다.
접속 후 Status >> Targets으로 들어가서 endpoint에 대한 URL을 클릭하면 수집되고 있는 metric 값이 나온다.


3) 웹브라우저로 접속하여 모니터링 테스트
- Grafana >> Home >> Dashboard에 접속해보면 이미 AKS의 Metric 값을 수집하여 보여준다.

수집 과정은 다음과 같다.
- 현재 helm을 통해서 배포된 Pod는 다음과 같다.

- 각 Pod에 대한 설명은 다음과 같다.
alertmanager-prom-stack-kube-prometheus-alertmanager-0
- prometheus에서 생성된 경고를 처리한다.
- 경고를 그룹화하고 중복을 제거하며 이메일, slack 등 다양한 채널로 알림을 보냄
prom-stack-grafana
- grafana는 데이터 시각화 모니터링 도구
- 해당 Pod가 실제 grafana 서버이다.
- prometheus & Loki 등 다양한 데이터 소스를 모니터링한다.
prom-stack-kube-prometheus-operator
- kubernetes 내에서 prometheus 인스턴스의 생성, 구성, 관리를 자동화한다.
- 모니터링 대상을 동적으로 구성하고 관리한다.
prom-stack-kube-state-metrics
- kubenetes API 서버에서 다양한 객체의 상태 메트릭을 생성
- 예를 들어 , 배포 상태, 노드 상태, Pod 상태등의 정보를 제공
prom-stack-prometheus-node-exporter
- Node Exporter는 호스트 시스템의 하드웨어 및 OS 메트릭을 수집
- CPU 사용량, 메모리 사용량, 디스트 I/O, 네트워크 통계 등을 제공
- 각 노드에 하나씩 배포 되어 있음.
prometheus-prom-stack-kube-prometheus-promethues-0
- 해당 Pod가 실제 Prometheus 서버이다.
- 메트릭을 수집, 저장, 처리하고 쿼리를 할 수 있게한다.
- 다른 exporter로부터 메트릭을 수집하고 저장한다.
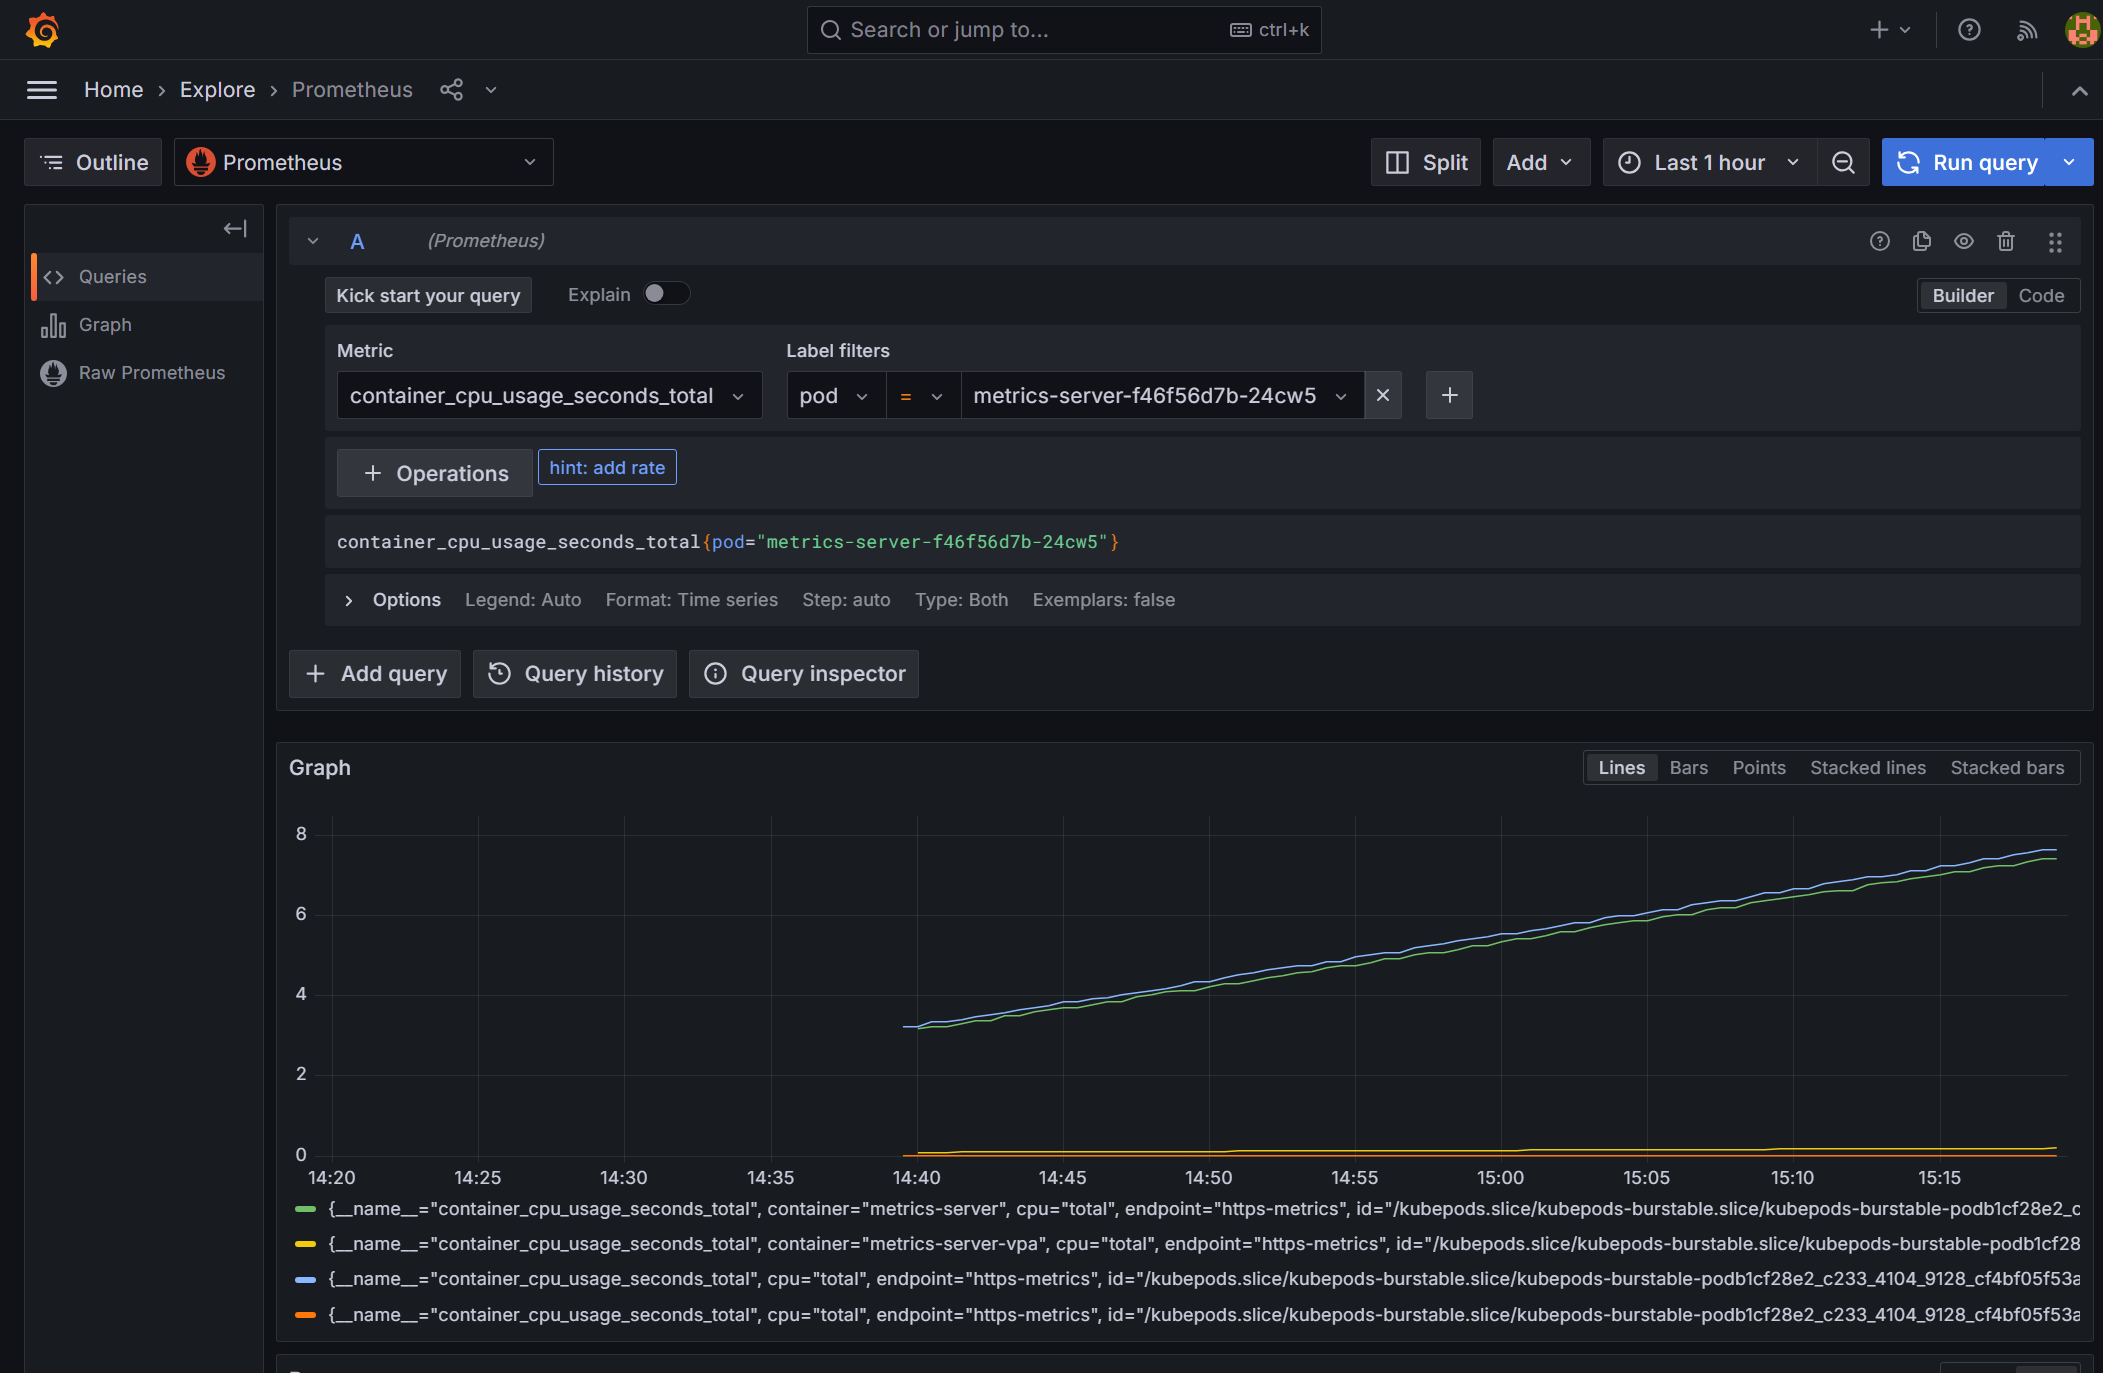
- Prometheus를 통해 AKS의 Metric 값을 수집해와서 Grafna에서 볼 수 있다.
예) metric-server-f46f56d7b-24cw5 Pod Container의 CPU 사용률을 Prometheus를 통해서 Metric 값을 가져오고 Grafana에서 볼 수 있다.
4) Loki 설치 후 모니터링 테스트
- helm repo 추가
helm repo add grafana https://grafana.github.io/helm-charts

helm repo update
- helm upgrade 하여 loki 설치
helm upgrade --install loki --namespace=loki-stack grafana/loki-stack --create-namespace
- Grafana와 Loki 연결
( connection URL : http://loki.loki-stack.svc.cluster.local:3100 or http://20.249.64.106:3100로 연결하면 원래 되어야하는거 같은데 왜 안되는걸까요..? )

(근데 Explore로 가면 로그 수집이 된다..)
아래 web Pod는 AKS에 연결되어있는 ACR에서 이미지를 가져와서 배포한 Pod 이다.

- Live Streaming 모니터링
Pod의 Service 인 10.0.4.223에 main으로 접근했을때 404 Not Found가 뜬다
해당 로그가 Loki에서 실시간으로 수집되는 것을 볼 수 있다.

5) Azure Storage Account로 장기 보존 로그 저장 및 관리
- 해당 과정을 하기 위해서는 loki-stack-2.yaml 파일을 따로 구성해서 helm upgrade를 해야한다.

- 해당 yaml파일에 storage account 속성을 지정한다.
loki:
  image:
    tag: 2.6.1
  enabled: true
  isDefault: true
  url: http://loki.loki-stack.svc.cluster.local:3100
  readinessProbe:
    httpGet:
      path: /ready
      port: http-metrics
    initialDelaySeconds: 45
  livenessProbe:
    httpGet:
      path: /ready
      port: http-metrics
    initialDelaySeconds: 45
  persistence:
    enabled: true
    accessModes:
      - ReadWriteOnce
    size: 10Gi
  extraVolumeMounts:
    - name: tsdb
      mountPath: /loki
  extraVolumes:
    - name: tsdb
      emptyDir: {}
  config:
    schema_config:
      configs:
        - from: "2020-12-11"
          index:
            period: 24h
            prefix: index_
          object_store: azure
          schema: v12
          store: tsdb
    storage_config:
      azure:
        account_name: terzmystg
        account_key: h7MEcm3J95D6/iDo/F0rfVOVT+p5u/n3V4+DIceK4VHSGavM32hamFlqNI+b9o4A3w3dZMNkkEpT+AStDsDfAw==
        container_name: loki-logs
        use_managed_identity: false
        request_timeout: 0
      tsdb_shipper:
        active_index_directory: /loki/index
        cache_location: /loki/index_cache
        cache_ttl: 24h
      filesystem:
        directory: /loki/chunks

promtail:
  enabled: true
  config:
    logLevel: info
    serverPort: 3101
    clients:
      - url: http://loki.loki-stack.svc.cluster.local:3100/loki/api/v1/push

grafana:
  enabled: true
  sidecar:
    datasources:
      label: ""
      labelValue: ""
      enabled: true
      maxLines: 1000
  image:
    tag: 10.3.3
- Private AKS일 경우 bind_addr을 설정해준다.
loki:
  image:
    tag: 2.6.1
  enabled: true
  isDefault: true
  url: http://loki.loki-stack.svc.cluster.local:3100
  readinessProbe:
    httpGet:
      path: /ready
      port: http-metrics
    initialDelaySeconds: 45
  livenessProbe:
    httpGet:
      path: /ready
      port: http-metrics
    initialDelaySeconds: 45
  persistence:
    enabled: true
    accessModes:
      - ReadWriteOnce
    size: 10Gi
  extraVolumeMounts:
    - name: tsdb
      mountPath: /loki
  extraVolumes:
    - name: tsdb
      emptyDir: {}
  config:
    memberlist:
      bind_addr:
        - 30.0.1.0/24
    schema_config:
      configs:
        - from: "2020-12-11"
          index:
            period: 24h
            prefix: index_
          object_store: azure
          schema: v12
          store: tsdb
    storage_config:
      azure:
        account_name: terzmystg
        account_key: h7MEcm3J95D6/iDo/F0rfVOVT+p5u/n3V4+DIceK4VHSGavM32hamFlqNI+b9o4A3w3dZMNkkEpT+AStDsDfAw==
        container_name: loki-logs
        use_managed_identity: false
        request_timeout: 0
      tsdb_shipper:
        active_index_directory: /loki/index
        cache_location: /loki/index_cache
        cache_ttl: 24h
      filesystem:
        directory: /loki/chunks

promtail:
  enabled: true
  config:
    logLevel: info
    serverPort: 3101
    clients:
      - url: http://loki.loki-stack.svc.cluster.local:3100/loki/api/v1/push

grafana:
  enabled: true
  sidecar:
    datasources:
      label: ""
      labelValue: ""
      enabled: true
      maxLines: 1000
  image:
    tag: 10.3.3
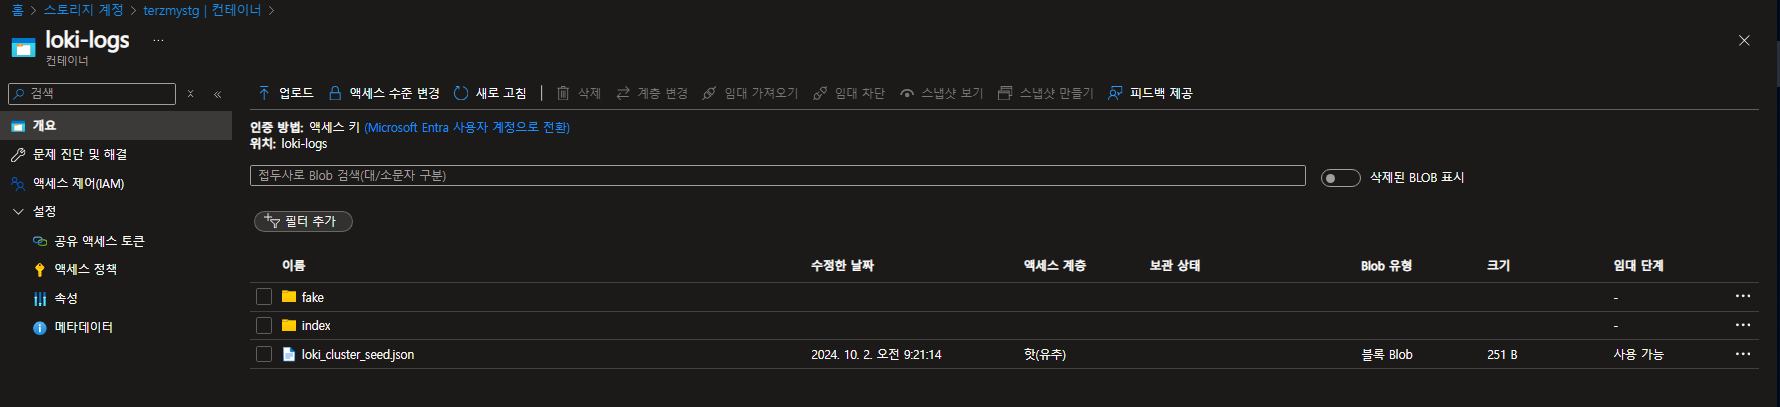
- Azure Blob Storage 확인
로그가 저장되긴 하는데 어떤 로그인지 파악이 필요하다.
loki-0에 대한 로그가 쌓이는거 같은데 확인이 필요하다.
( Cursor AI가 답하길 해당 로그는 Kubernetes 클러스터 내의 모든 파드 로그 or 시스템 로그 or 애플리케이션 로그 라고 합니다..)


'Azure' 카테고리의 다른 글
| Azure Blob Storage & SAS Token & Azure SDK for Java (1) | 2024.10.11 |
|---|---|
| Managed Grafana & Prometheus를 이용한 AKS Monitoring (0) | 2024.10.04 |
| GitLab & Jenkins를 이용한 AKS CI/CD (0) | 2024.09.25 |
| Azure Kubernetes Service & Cert-Manager (0) | 2024.09.07 |
| AWS EC2(docker swarm)에서 Azure Kubernetes Service Migration (0) | 2024.07.17 |