
목적
Azure Kubernets Serivce(이하 AKS)에서 컨테이너 로그를 사용자 지정화하여 Log Analytics에서 모니터링이 가능합니다.
AKS에서 Log Analytics Monitoring Agent의 사용자 정의 구성을 통해서 사용자 지정 로그 모니터링이 가능합니다.
여기서는 AKS 시스템 컴포넌트인 Kube-system 네임스페이스 로그 수집 설정 가이드를 설명하도록 하겠습니다.
AKS 모니터링 설정
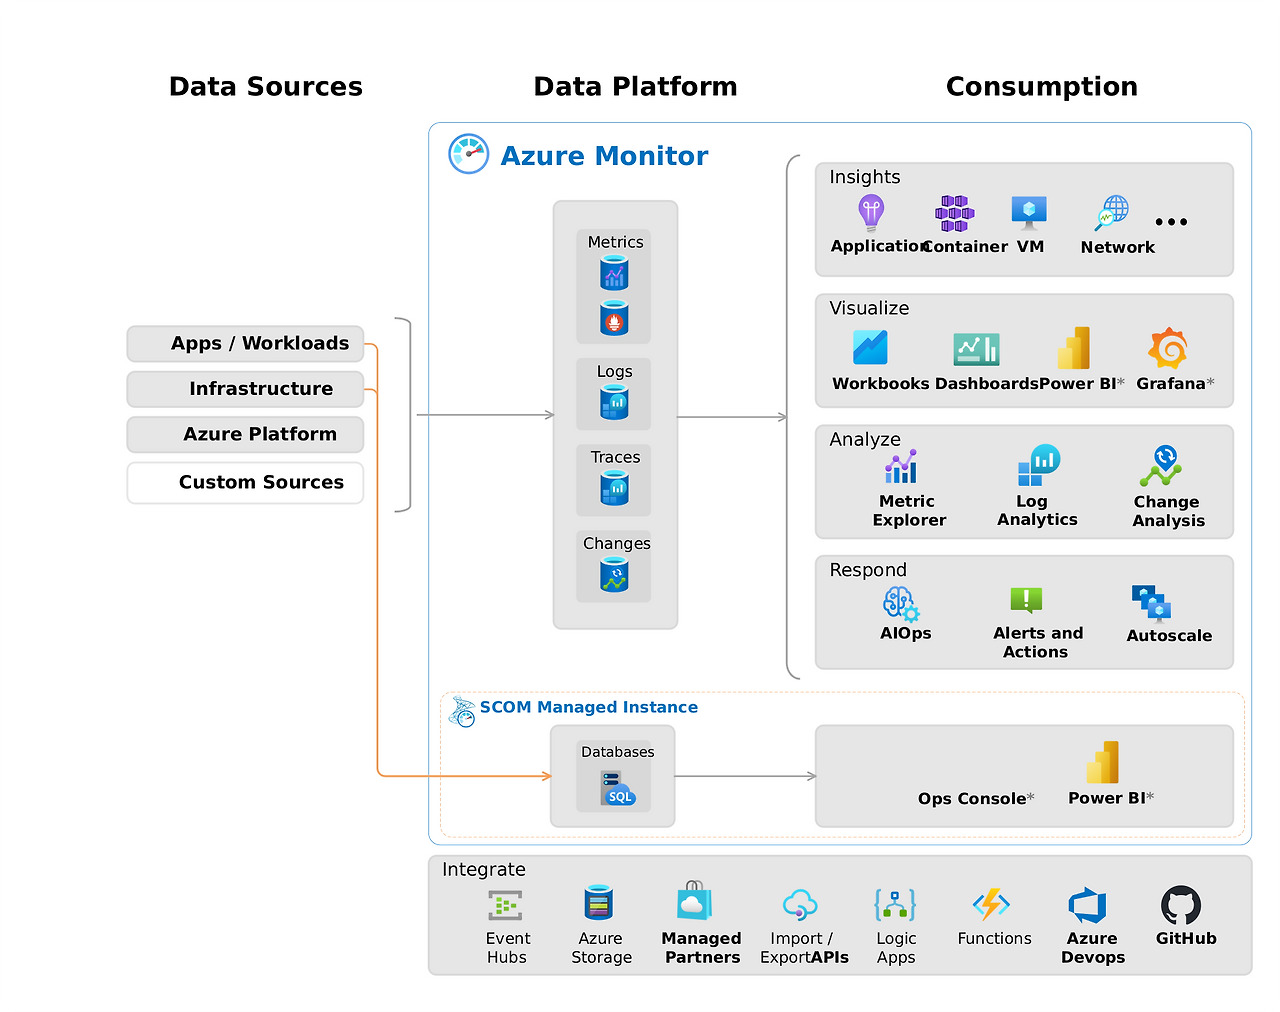
우선, AKS의 Pod Application의 로그를 모니터링 하기 위해서 어떤식으로 수집되고 어떤 로그가 모니터링되는지 동작 방식부터 알아보겠습니다.
일단 AKS 모니터링은 Azure Monitor Add-on을 통해 이루어집니다. AKS 클러스터 생성 시 모니터링 설정 단계에서 "컨테이너 인사이트"를 활성화 하거나 AKS 생성 후에는 아래 이미지와 같이 컨테이너 로그를 활성화하면 AKS 컨테이너 모니터링이 가능해집니다.

모니터링 구성
모니터링이 가능하게 설정이 되고 나서 이제 어떻게 구성이 되어있는지 알아보도록 하겠습니다.
일반적으로 모니터링 도구는 Prometheus와 Grafana를 사용합니다.
Prometheus는 메트릭 로그 수집을 위해서 사용하는 것이며 Grafana의 경우 Prometheus에서 수집된 로그를 시각화하기 위해 사용됩니다.
Prometheus에서는 Node Exporter라는 Agent를 통해서 시스템 리소스 메트릭 로그를 수집합니다.
(여기서 시스템 로그 메트릭은 CPU,Memory, Disk, Network 등을 말합니다.)
AKS에서는 Node Exporter 역할을하는 별도의 Pod를 설치해줘야합니다.
여기서 설치되는 Pod(로그 수집 Agent)가 AMA(Azure Monitoring Agent)입니다.
AMA(Azure Monitoring Agent)는 Demonset 기반으로 노드 당 하나씩 Pod가 배포되게 됩니다.
AMA는 container-azm-ms-agentconfig라는 ConfigMap을 볼륨 마운트합니다.
그래서 해당 ConfigMap을 수정하면 에이전트가 자동으로 새 설정을 적용하게 됩니다.
그러므로 ConfigMap을 수정하여 사용자 지정 로그 분석이 가능합니다.
ConfigMap을 통해 다음과 같은 설정을 지정할 수 있습니다.
1. 로그 수집 대상 네임스페이스 포함/제외
2. 로그 수집 빈도 설정
3. 특정 컨테이너 로그 필터링
전 여기서 굳이 수정이 필요한가 ? 라는 의문이 생겼습니다. 답변을 하자면,,
실질적으로 운영환경에서 모든 네임스페이스의 로그를 수집하게되면 비용이 많이 발생할 수 있습니다.
특히 시스템 로그의 경우 많은 트랜잭션에 의해서 많은 로그가 수집되어 Log Analytics에 저장 및 관리되므로 비용 측면에서 과금이 발생할 수 있습니다. (>> Log Analytics 비쌉니다..)
여기서 kube-system 네임스페이스에 대해서 로그 수집를 진행하려고합니다.
하지만, kube-system은 Microsoft에서 관리하는 컨트롤 플레인에서 실행되므로 AMA가 설치된다고해도 LogAnalytics로 로그 수집이 되지 않습니다.
!! 기본적으로 AMA 설정 파일인 container-azm-ms-agentconfig 라는 ConfigMap은 kube-system 네임스페이스 로그 수집을 제외하도록 설정되어있습니다. 이는 앞서 말했듯이 많은 로그가 쌓이게 되면 비용과 저장 공간을 차지할 수 있기 때문입니다.
따라서, 시스템 로그를 Log Analytics로 수집하기 위해서는 해당 ConfigMap에서 예외처리를 수정해줘야 가능합니다.

Demo
1. Azure Kubernetes Service Cluster 생성
# create an AKS cluster

$AKS_RG="terzmy-rg"
$AKS_NAME="terzmy-aks-cluster"

az group create --name $AKS_RG --location koreacentral

az aks create -g $AKS_RG -n $AKS_NAME --network-plugin azure --node-vm-size "Standard_B2als_v2" --enable-addons monitoring

az aks get-credentials -g $AKS_RG -n $AKS_NAME --overwrite-existing
2. AMA-log LogAnalytics Pod 확인
AKS 컨테이너 인사이트 모니터링 활성화 후 ama-log pod가 생성됩니다.
ama-log pod는 Demoset 기반으로 배포되기 때문에 노드가 2개 형성되어있어 두 개의 ama-log pod가 배포되었습니다.
# check log analytics pods called ama-logs

kubectl get pods -n kube-system -l component=ama-logs-agent
3. kube-system namespace 로그 확인
kube-system namespace의 로그를 확인하기 위해서 예로 coreDNS 로그를 확인해봅니다.
# check logs from kube-system namespace

kubectl get pods -n kube-system

kubectl logs -n kube-system -l k8s-app=kube-dns
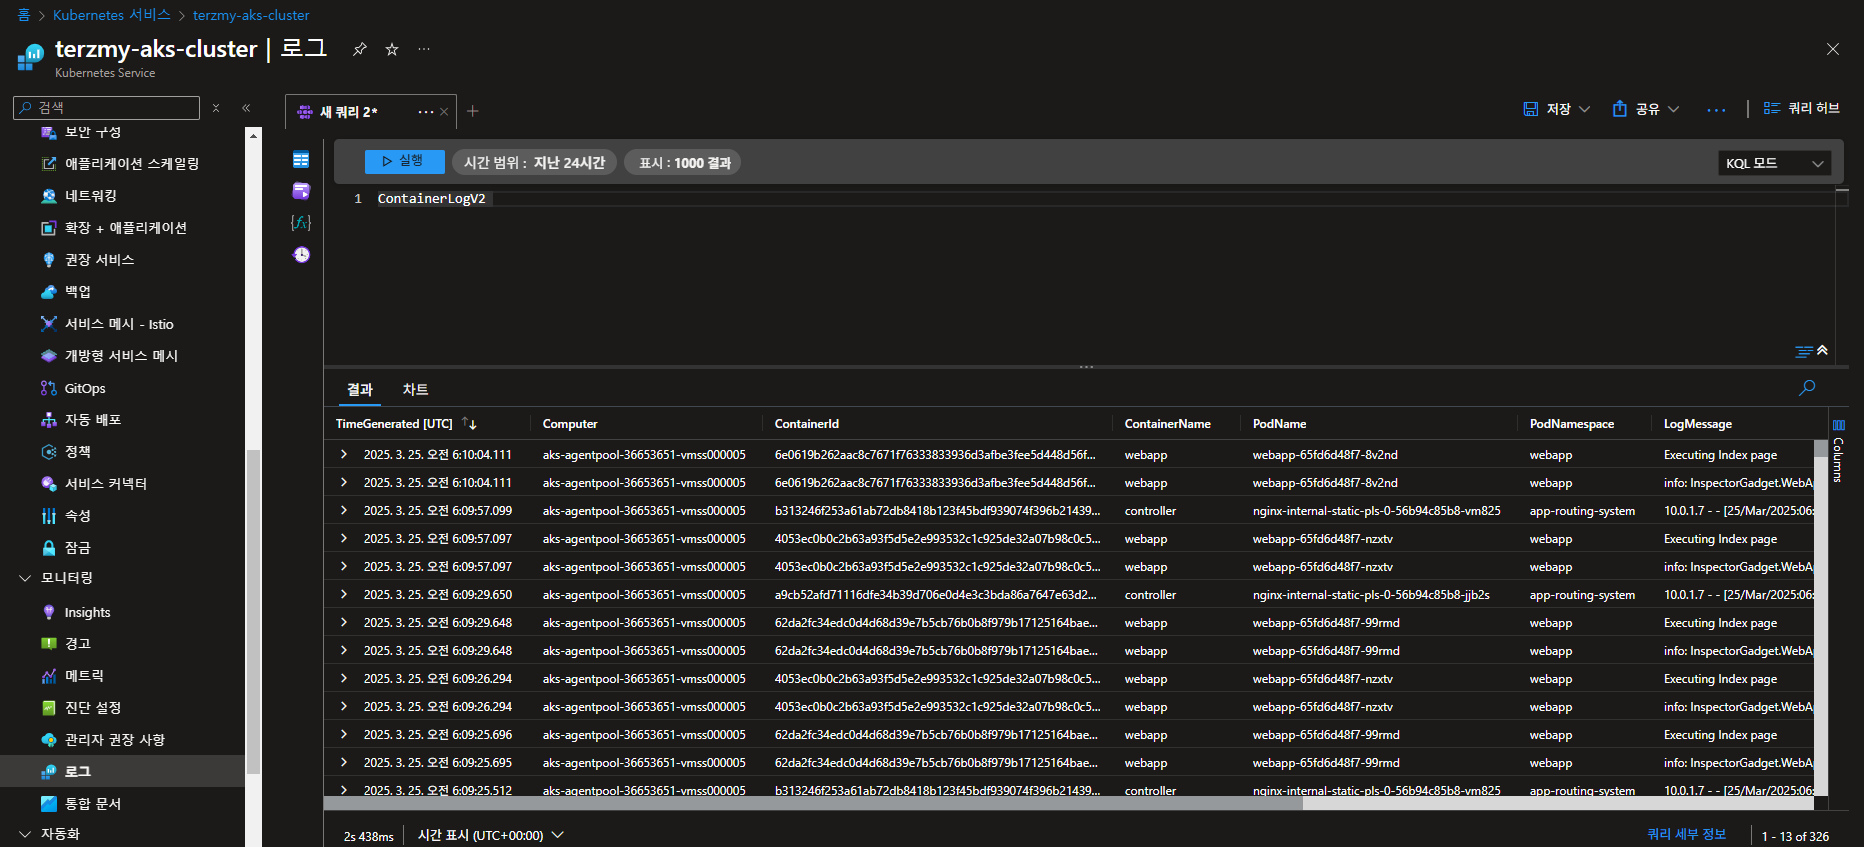
4. kube-system namespace 로그 Log Analytics 확인
현재 위 이미지에서 보이는 kube-system namespace 로그는 확인되지 않고 그 외 namespace에 대한 로그만 확인이 가능합니다.
왜냐하면, 앞서 말했듯이 kube-system 로그는 기본적으로 수집이 안되도록 ama-log pod에 configmap으로 설정이 되어있기 때문입니다.
로그 확인 방법 : AKS >> 모니터링 >> 로그 >> ContainerLogsv2
5. Log Analytics Agent configmap 설정 변경
ama-log의 configuration을 변경하기 위해서는 ama-logs-rs-config와 container-azm-ms-aks-k8scluster라는 configmap에 대해서 알 필요가 있습니다.
# check configmap from kube-system namespace

kubectl get cm -n kube-system
우선, ama-logs-rs-config에 대해서 알아보도록 하겠습니다.
1) ama-logs-rs-config
목적 : Fluentd 기반의 로그 수집 에이전트 설정을 위한 configMap입니다.
" 어떻게 로그를 수집할 것인가?! "
기능 : 주로 클러스터 구성 요소 (kubeAPI등)의 로그를 수집하는데 초점을 맞춥니다.
로그 데이터 전달 방법, 포트 바인딩, 청크 크기 제한등을 설정합니다.
Azure Monitor Agent가 클러스터 로그를 수집하여 Azure Log Analytics에 전송하는 방법을 정의합니다.

다음으로 container-azm-ms-aks-k8scluste에 대해서 알아보도록 하겠습니다.
2) container-azm-ms-aks-k8scluster
목적 : Azure Monitor for Container의 주요 설정 ConfigMap입니다.
" 무엇을 모니터링 할 것인가 ?! "
기능 : AKS 클러스터의 전반적인 모니터링 설정을 관리합니다.
수집할 컨테이너 로그의 종류 및 네임스페이스 필터링 설정
프로메테우스 메트릭 스크래핑 구성
Log Analytics 워크스페이스 연결 정보 등

그럼, kube-system namespace에 대한 모니터링을 위해서 container-azm-ms-aks-k8scluster configmap을 업데이트하도록 하겠습니다. 아래 yml 파일 내용은 microsoft에서 제공하는 sample yml 정보입니다.
# src: https://raw.githubusercontent.com/microsoft/Docker-Provider/ci_prod/kubernetes/container-azm-ms-agentconfig.yaml
# doc: https://learn.microsoft.com/en-us/azure/azure-monitor/containers/container-insights-agent-config

kind: ConfigMap
apiVersion: v1
metadata:
  name: container-azm-ms-agentconfig
  namespace: kube-system
data:
  schema-version:
    #string.used by agent to parse config. supported versions are {v1}. Configs with other schema versions will be rejected by the agent.
    v1
  config-version:
    #string.used by customer to keep track of this config file's version in their source control/repository (max allowed 10 chars, other chars will be truncated)
    ver1
  log-data-collection-settings: |-
    # Log data collection settings
    # Any errors related to config map settings can be found in the KubeMonAgentEvents table in the Log Analytics workspace that the cluster is sending data to.

    [log_collection_settings]
       [log_collection_settings.stdout]
          # In the absense of this configmap, default value for enabled is true
          enabled = true
          # exclude_namespaces setting holds good only if enabled is set to true
          # kube-system,gatekeeper-system log collection are disabled by default in the absence of 'log_collection_settings.stdout' setting. If you want to enable kube-system,gatekeeper-system, remove them from the following setting.
          # If you want to continue to disable kube-system,gatekeeper-system log collection keep the namespaces in the following setting and add any other namespace you want to disable log collection to the array.
          # In the absense of this configmap, default value for exclude_namespaces = ["kube-system","gatekeeper-system"]
          exclude_namespaces = ["gatekeeper-system"] # ["kube-system","gatekeeper-system"]

       [log_collection_settings.stderr]
          # Default value for enabled is true
          enabled = true
          # exclude_namespaces setting holds good only if enabled is set to true
          # kube-system,gatekeeper-system log collection are disabled by default in the absence of 'log_collection_settings.stderr' setting. If you want to enable kube-system,gatekeeper-system, remove them from the following setting.
          # If you want to continue to disable kube-system,gatekeeper-system log collection keep the namespaces in the following setting and add any other namespace you want to disable log collection to the array.
          # In the absense of this configmap, default value for exclude_namespaces = ["kube-system","gatekeeper-system"]
          exclude_namespaces = ["gatekeeper-system"] # ["kube-system","gatekeeper-system"]

       [log_collection_settings.env_var]
          # In the absense of this configmap, default value for enabled is true
          enabled = true
       [log_collection_settings.enrich_container_logs]
          # In the absense of this configmap, default value for enrich_container_logs is false
          enabled = true
          # When this is enabled (enabled = true), every container log entry (both stdout & stderr) will be enriched with container Name & container Image
       [log_collection_settings.collect_all_kube_events]
          # In the absense of this configmap, default value for collect_all_kube_events is false
          # When the setting is set to false, only the kube events with !normal event type will be collected
          enabled = false
          # When this is enabled (enabled = true), all kube events including normal events will be collected
       [log_collection_settings.schema]
          # In the absence of this configmap, default value for containerlog_schema_version is "v1"
          # Supported values for this setting are "v1","v2"
          # See documentation at https://aka.ms/ContainerLogv2 for benefits of v2 schema over v1 schema before opting for "v2" schema
          containerlog_schema_version = "v2"
       [log_collection_settings.enable_multiline_logs]
          # fluent-bit based multiline log collection for .NET, Go, Java, and Python stacktraces.
          # if enabled will also stitch together container logs split by docker/cri due to size limits(16KB per log line)
          enabled = "false"


  prometheus-data-collection-settings: |-
    # Custom Prometheus metrics data collection settings
    [prometheus_data_collection_settings.cluster]
        # Cluster level scrape endpoint(s). These metrics will be scraped from agent's Replicaset (singleton)
        # Any errors related to prometheus scraping can be found in the KubeMonAgentEvents table in the Log Analytics workspace that the cluster is sending data to.

        #Interval specifying how often to scrape for metrics. This is duration of time and can be specified for supporting settings by combining an integer value and time unit as a string value. Valid time units are ns, us (or µs), ms, s, m, h.
        interval = "1m"

        ## Uncomment the following settings with valid string arrays for prometheus scraping
        #fieldpass = ["metric_to_pass1", "metric_to_pass12"]

        #fielddrop = ["metric_to_drop"]

        # An array of urls to scrape metrics from.
        # urls = ["http://myurl:9101/metrics"]

        # An array of Kubernetes services to scrape metrics from.
        # kubernetes_services = ["http://my-service-dns.my-namespace:9102/metrics"]

        # When monitor_kubernetes_pods = true, replicaset will scrape Kubernetes pods for the following prometheus annotations:
        # - prometheus.io/scrape: Enable scraping for this pod
        # - prometheus.io/scheme: Default is http
        # - prometheus.io/path: If the metrics path is not /metrics, define it with this annotation.
        # - prometheus.io/port: If port is not 9102 use this annotation
        monitor_kubernetes_pods = false

        ## Restricts Kubernetes monitoring to namespaces for pods that have annotations set and are scraped using the monitor_kubernetes_pods setting.
        ## This will take effect when monitor_kubernetes_pods is set to true
        ##   ex: monitor_kubernetes_pods_namespaces = ["default1", "default2", "default3"]
        # monitor_kubernetes_pods_namespaces = ["default1"]

        ## Label selector to target pods which have the specified label
        ## This will take effect when monitor_kubernetes_pods is set to true
        ## Reference the docs at https://kubernetes.io/docs/concepts/overview/working-with-objects/labels/#label-selectors
        # kubernetes_label_selector = "env=dev,app=nginx"

        ## Field selector to target pods which have the specified field
        ## This will take effect when monitor_kubernetes_pods is set to true
        ## Reference the docs at https://kubernetes.io/docs/concepts/overview/working-with-objects/field-selectors/
        ## eg. To scrape pods on a specific node
        # kubernetes_field_selector = "spec.nodeName=$HOSTNAME"

    [prometheus_data_collection_settings.node]
        # Node level scrape endpoint(s). These metrics will be scraped from agent's DaemonSet running in every node in the cluster
        # Any errors related to prometheus scraping can be found in the KubeMonAgentEvents table in the Log Analytics workspace that the cluster is sending data to.

        #Interval specifying how often to scrape for metrics. This is duration of time and can be specified for supporting settings by combining an integer value and time unit as a string value. Valid time units are ns, us (or µs), ms, s, m, h.
        interval = "1m"

        ## Uncomment the following settings with valid string arrays for prometheus scraping

        # An array of urls to scrape metrics from. $NODE_IP (all upper case) will substitute of running Node's IP address
        # urls = ["http://$NODE_IP:9103/metrics"]

        #fieldpass = ["metric_to_pass1", "metric_to_pass12"]

        #fielddrop = ["metric_to_drop"]

  metric_collection_settings: |-
    # Metrics collection settings for metrics sent to Log Analytics and MDM
    [metric_collection_settings.collect_kube_system_pv_metrics]
      # In the absense of this configmap, default value for collect_kube_system_pv_metrics is false
      # When the setting is set to false, only the persistent volume metrics outside the kube-system namespace will be collected
      enabled = false
      # When this is enabled (enabled = true), persistent volume metrics including those in the kube-system namespace will be collected

  alertable-metrics-configuration-settings: |-
    # Alertable metrics configuration settings for container resource utilization
    [alertable_metrics_configuration_settings.container_resource_utilization_thresholds]
        # The threshold(Type Float) will be rounded off to 2 decimal points
        # Threshold for container cpu, metric will be sent only when cpu utilization exceeds or becomes equal to the following percentage
        container_cpu_threshold_percentage = 95.0
        # Threshold for container memoryRss, metric will be sent only when memory rss exceeds or becomes equal to the following percentage
        container_memory_rss_threshold_percentage = 95.0
        # Threshold for container memoryWorkingSet, metric will be sent only when memory working set exceeds or becomes equal to the following percentage
        container_memory_working_set_threshold_percentage = 95.0

    # Alertable metrics configuration settings for persistent volume utilization
    [alertable_metrics_configuration_settings.pv_utilization_thresholds]
        # Threshold for persistent volume usage bytes, metric will be sent only when persistent volume utilization exceeds or becomes equal to the following percentage
        pv_usage_threshold_percentage = 60.0

    # Alertable metrics configuration settings for completed jobs count
    [alertable_metrics_configuration_settings.job_completion_threshold]
        # Threshold for completed job count , metric will be sent only for those jobs which were completed earlier than the following threshold
        job_completion_threshold_time_minutes = 360
  integrations: |-
    [integrations.azure_network_policy_manager]
        collect_basic_metrics = false
        collect_advanced_metrics = false
    [integrations.azure_subnet_ip_usage]
        enabled = false

# Doc - https://github.com/microsoft/Docker-Provider/blob/ci_prod/Documentation/AgentSettings/ReadMe.md
  agent-settings: |-
    # prometheus scrape fluent bit settings for high scale
    # buffer size should be greater than or equal to chunk size else we set it to chunk size.
    # settings scoped to prometheus sidecar container. all values in mb
    [agent_settings.prometheus_fbit_settings]
      tcp_listener_chunk_size = 10
      tcp_listener_buffer_size = 10
      tcp_listener_mem_buf_limit = 200

    # prometheus scrape fluent bit settings for high scale
    # buffer size should be greater than or equal to chunk size else we set it to chunk size.
    # settings scoped to daemonset container. all values in mb
    # [agent_settings.node_prometheus_fbit_settings]
      # tcp_listener_chunk_size = 1
      # tcp_listener_buffer_size = 1
      # tcp_listener_mem_buf_limit = 10

    # prometheus scrape fluent bit settings for high scale
    # buffer size should be greater than or equal to chunk size else we set it to chunk size.
    # settings scoped to replicaset container. all values in mb
    # [agent_settings.cluster_prometheus_fbit_settings]
      # tcp_listener_chunk_size = 1
      # tcp_listener_buffer_size = 1
      # tcp_listener_mem_buf_limit = 10

    # The following settings are "undocumented", we don't recommend uncommenting them unless directed by Microsoft.
    # They increase the maximum stdout/stderr log collection rate but will also cause higher cpu/memory usage.
    ## Ref for more details about Ignore_Older -  https://docs.fluentbit.io/manual/v/1.7/pipeline/inputs/tail
    # [agent_settings.fbit_config]
    #   log_flush_interval_secs = "1"                 # default value is 15
    #   tail_mem_buf_limit_megabytes = "10"           # default value is 10
    #   tail_buf_chunksize_megabytes = "1"            # default value is 32kb (comment out this line for default)
    #   tail_buf_maxsize_megabytes = "1"              # default value is 32kb (comment out this line for default)
    #   tail_ignore_older = "5m"                      # default value same as fluent-bit default i.e.0m

    # On both AKS & Arc K8s enviornments, if Cluster has configured with Forward Proxy then Proxy settings automatically applied and used for the agent
    # Certain configurations, proxy config should be ignored for example Cluster with AMPLS + Proxy
    # in such scenarios, use the following config to ignore proxy settings
    # [agent_settings.proxy_config]
    #    ignore_proxy_settings = "true"  # if this is not applied, default value is false

    # The following settings are "undocumented", we don't recommend uncommenting them unless directed by Microsoft.
    # Configuration settings for the waittime for the network listeners to be available
    # [agent_settings.network_listener_waittime]
    #   tcp_port_25226 = 45                           # Port 25226 is used for telegraf to fluent-bit data in ReplicaSet
    #   tcp_port_25228 = 60                           # Port 25228 is used for telegraf to fluentd data
    #   tcp_port_25229 = 45                           # Port 25229 is used for telegraf to fluent-bit data in DaemonSet

    # The following settings are "undocumented", we don't recommend uncommenting them unless directed by Microsoft.
    # [agent_settings.mdsd_config]
    #   monitoring_max_event_rate = "50000" # default 20K eps
    #   backpressure_memory_threshold_in_mb = "1500" # default 3500MB
    #   upload_max_size_in_mb = "20"  # default 2MB
    #   upload_frequency_seconds = "1" # default 60 upload_frequency_seconds
    #   compression_level = "0"  # supported levels 0 to 9 and 0 means no compression
일단 위 configmap으로 업데이트하기 전 어떤 configmap 정보가 변경되었는지 확인합니다.
기본적으로 container-azm-ms-agentconfig라는 configmap은 kube-system 네임스페이스 로그 수집을 제외시키지만, 아래 빨간 박스처럼 #으로 예외 처리를 제외하면 kube-system 네임스페이스 로그를 수집하게 됩니다.
해당 configmap yml을 업데이트 적용해보도록 하겠습니다.

새로운 configmap 설정을 업데이트 진행합니다.
# apply the new configuration

kubectl apply -f container-azm-ms-agentconfig.yaml
configmap 업데이트를 진행하게되면 AMA Pod들이 재시작이 진행됩니다.

Daemonset으로 배포된 Pod이기 때문에 적용이 잘 되었는지 Daemonset에서 확인을 진행합니다.
container-azm-ms-agentconfig 라는 이름으로 Demonset의 configmap 설정이 마운트 된 것을 볼 수 있습니다.
kubectl get ds -n kube-system -l component=ama-logs-agent -o yaml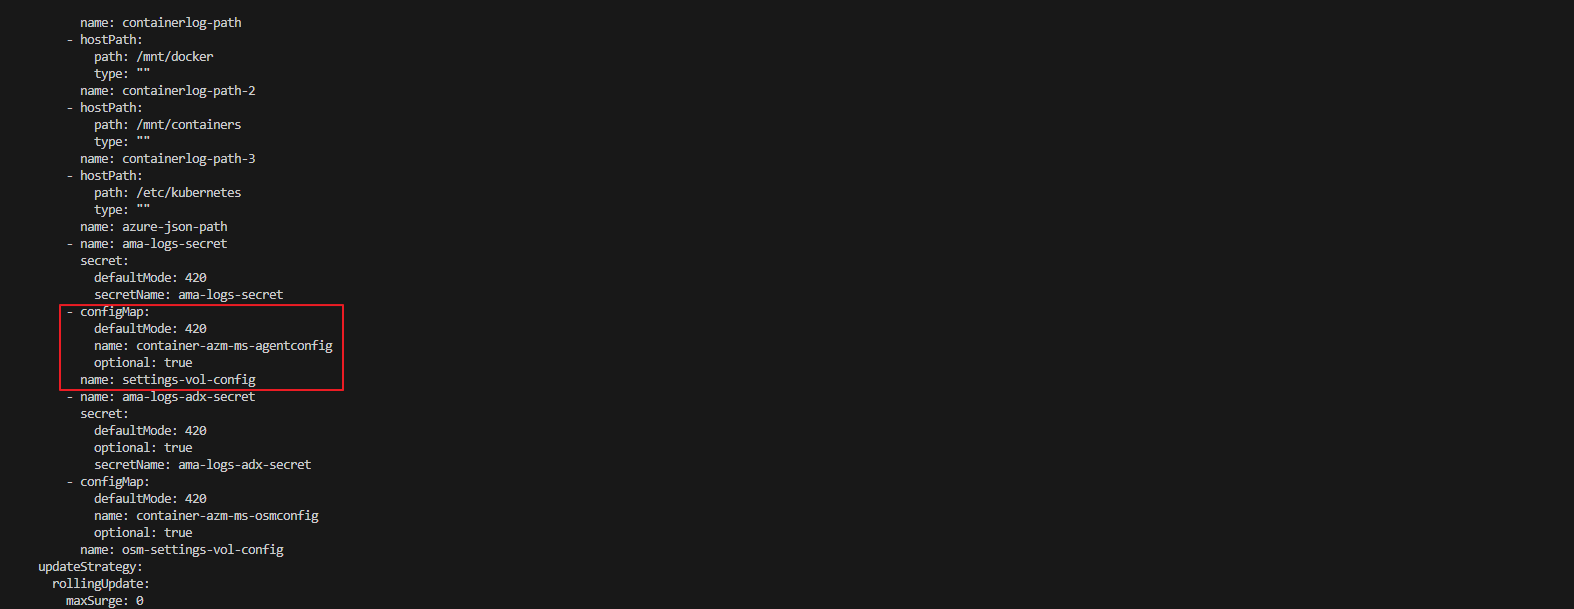
6. kube-system namespace 로그 수집 확인
Azure Log Analytics에서 kube-system coredns Pod의 로그가 정상적으로 수집되고 있는지 확인합니다.

'Azure' 카테고리의 다른 글
| Azure Monitoring Agent 인증 및 권한 부여 프로세스 (9) | 2025.04.01 |
|---|---|
| AKS Monitoring with Prometheus, Grafana and Log Analytics (0) | 2025.03.28 |
| Exposing AKS Apps Using Front Door And Private Link Service (1) | 2025.03.20 |
| Azure CDN 응답 속도 이슈 (1) | 2025.02.19 |
| Azure Application Gateway WAF (0) | 2025.02.10 |